We love quality journalism and digital projects that are built with love. During the summer we already treated you with a bunch of cool digital stories from the first half of this year. We have more in store for you. We selected the best interactives, graphics, longreads and data visualizations from media companies all around the world. It’s time to get inspired ánd take action. This time we are also giving DIY advice on how to build similar projects.
Pointer – The story behind an identity theft
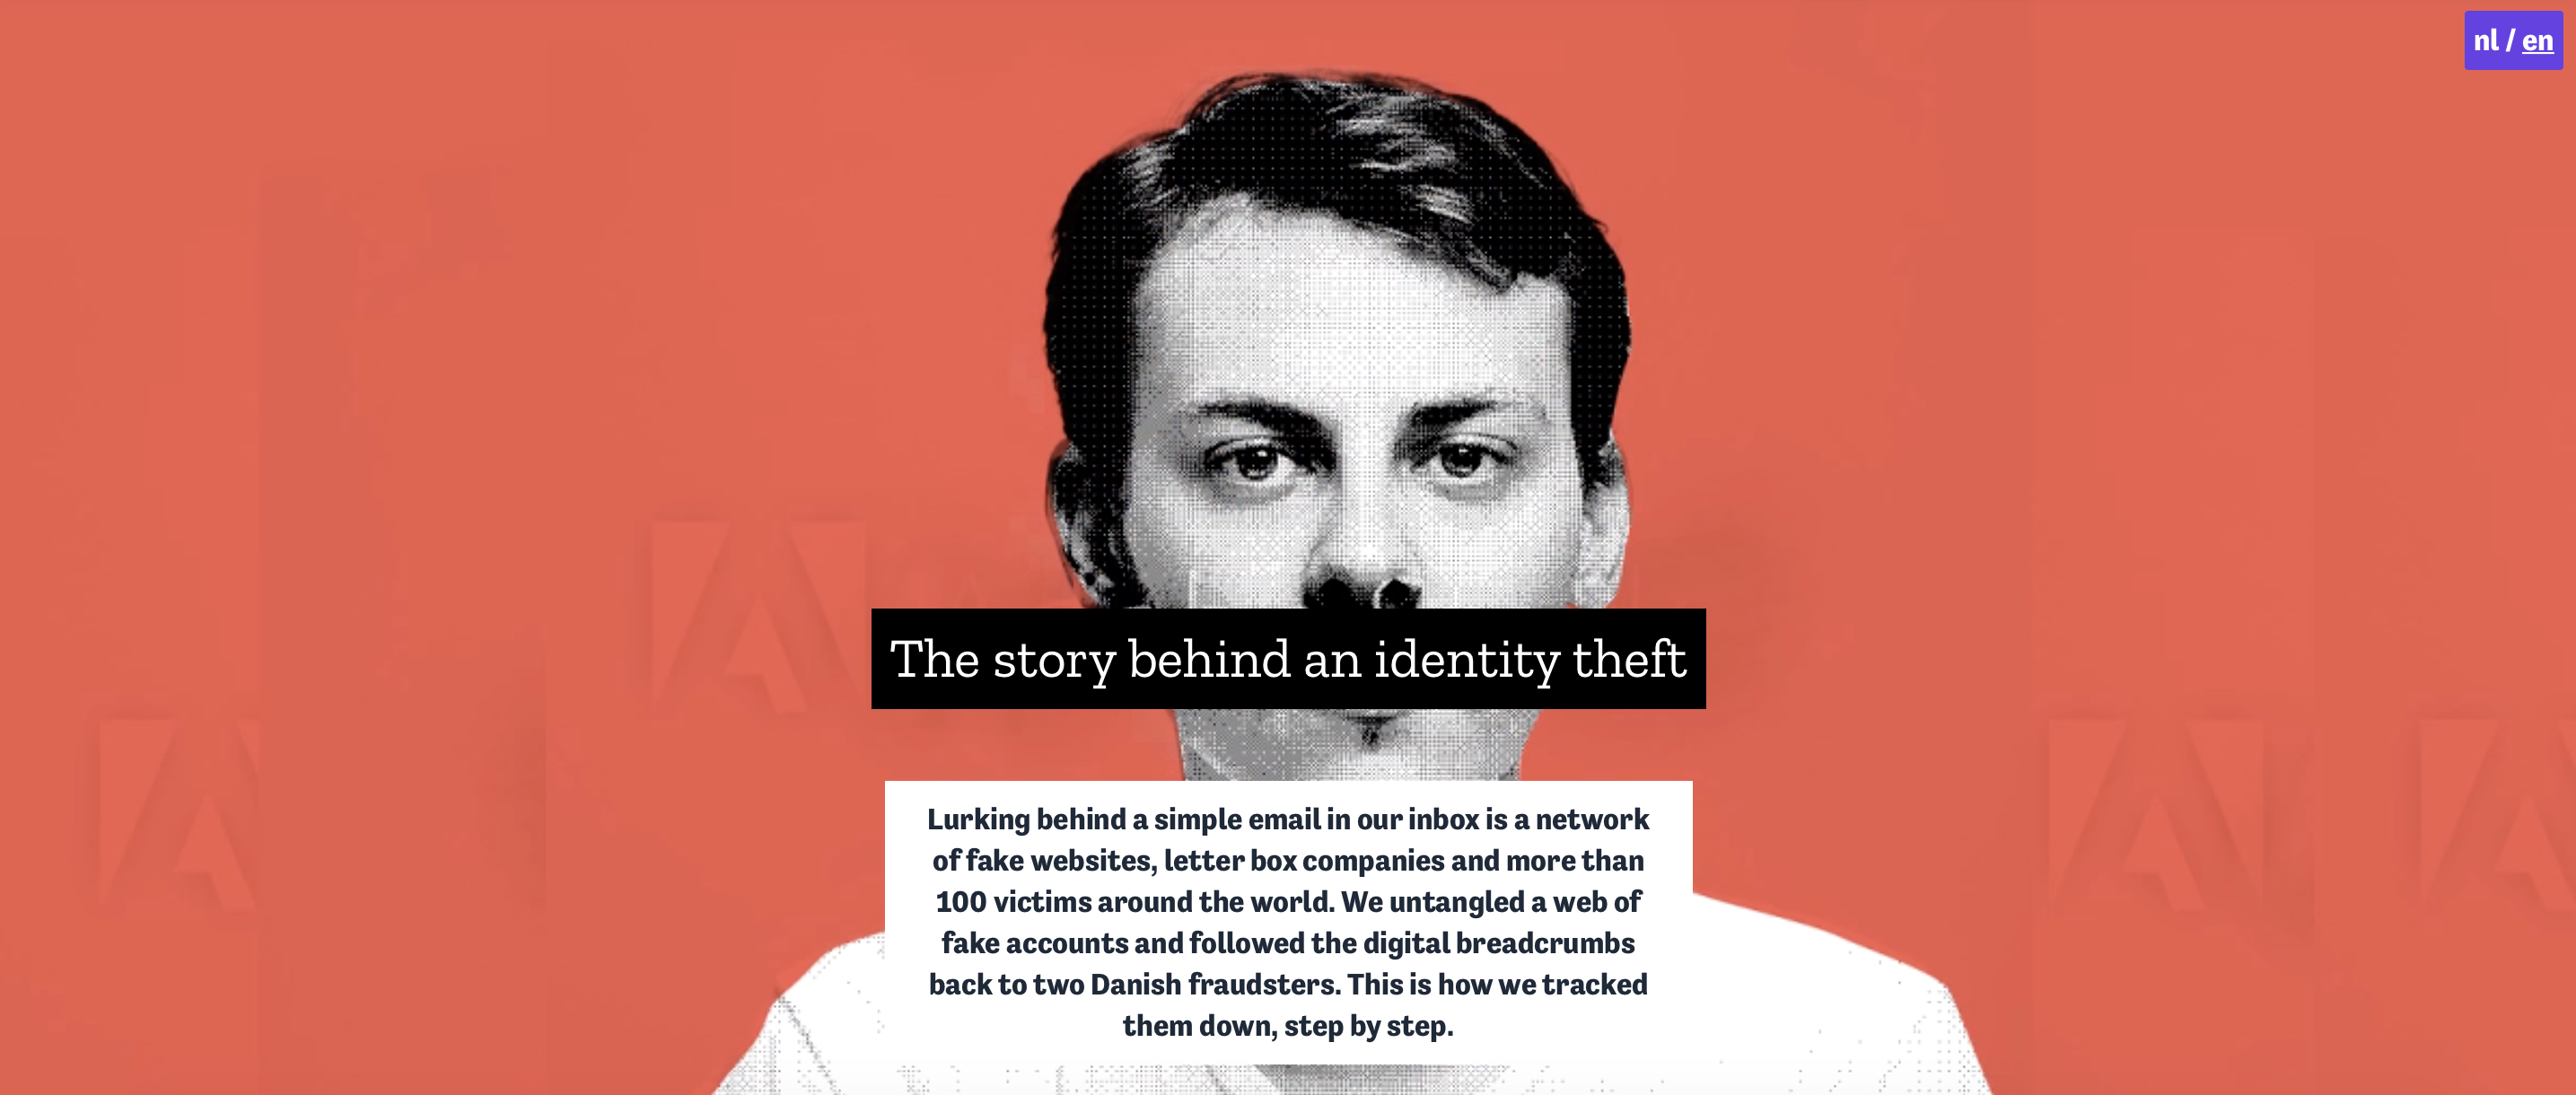
Lurking behind a simple email in the inbox of the newsroom is a network of fake websites, letter box companies and more than 100 victims around the world. In this very impressive scrolly they let you read the emails, and follow every step of their research. One of our favorites of 2019!
DIY: This project was custom built by developers. You don’t need a whole team and loads of money to build a similar story. Yes, tools have their limitations compared to custom build projects, but a little creativity goes a long way. To DIY this project try the animation tool Powtoon or if you want it to be a scrolly try the WordPress plugin Snowball. Create interview like stories with InterviewJS.
The Guardian – Air pollution may be damaging ‘every organ in the body’

Scroll through the human body and learn about the effects on your organs.
DIY: Try to make a scrolly with beautiful visuals by using tools like Adobe Spark (free) and Shorthand (paid).
NOS op 3 – Echte Liefde (Dutch)
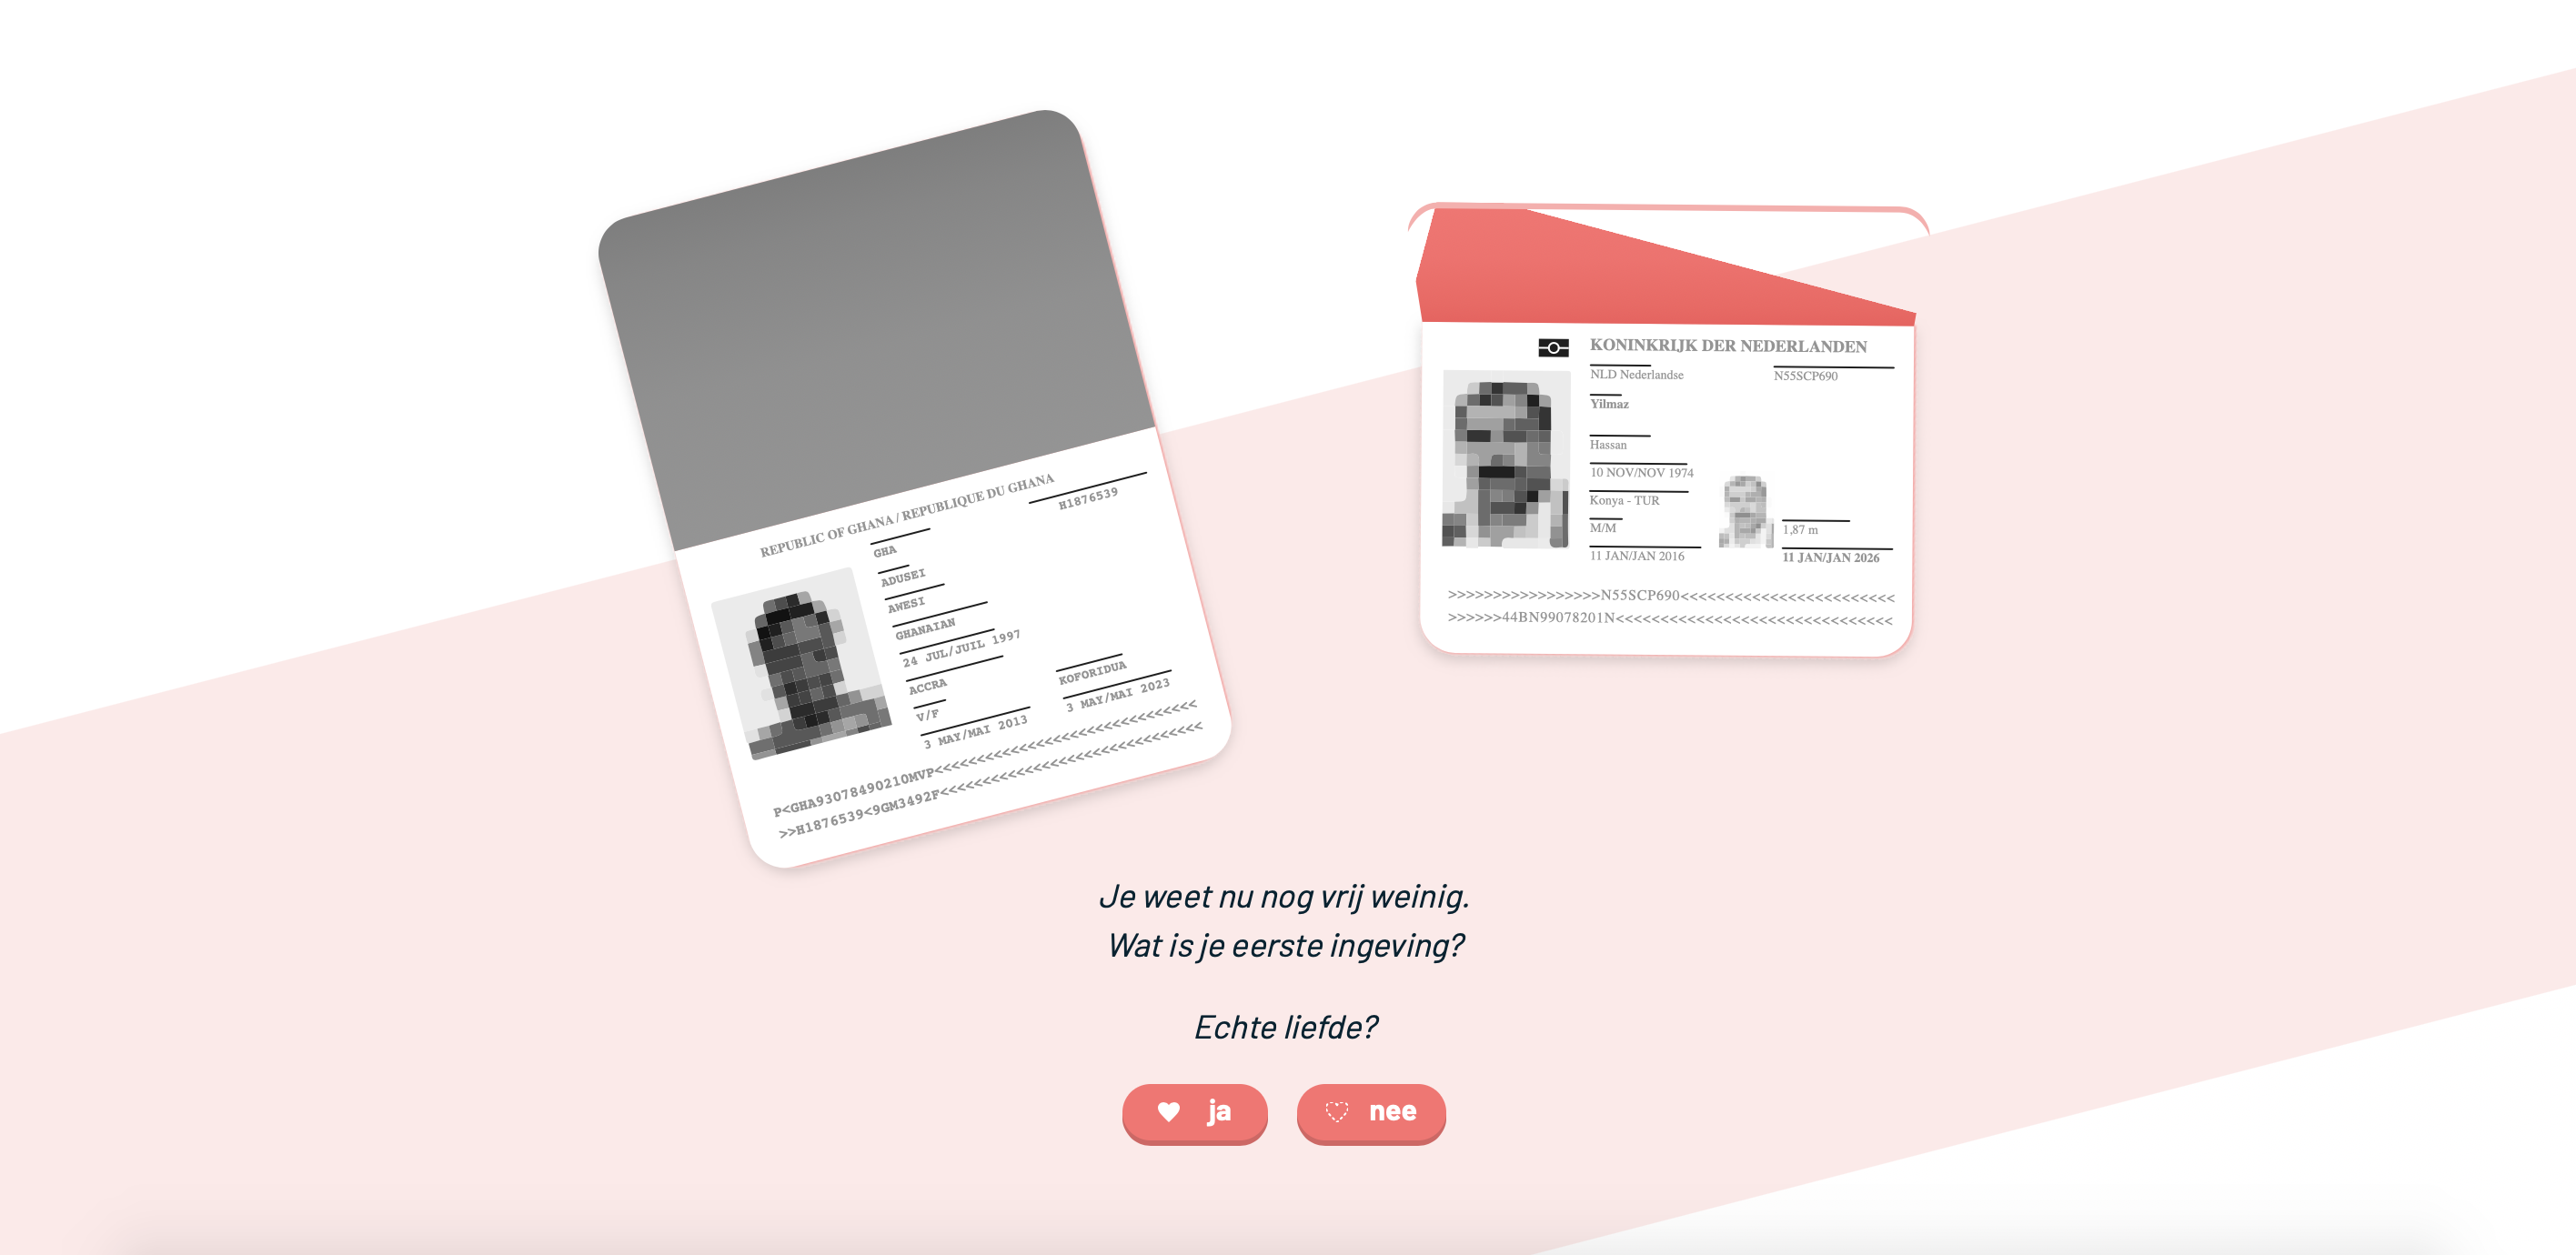
When do you know if it’s true love? This a multimedia story, a game and longread all in one. It tells you the love story of Hassan and Awesi. They want to live together in The Netherlands after falling in love on their holiday in Ghana. The only problem is that neither Hassan or Awesi is Dutch. The Immigration Service needs to judge: is this really love? This interactive let you make the decisions. Is it true love or not …?
DIY: Interactives are not easy to make, but thinkering is definitely worth your time. Try Klynt or Eko to create something similar.
NTR & Rijksmuseum – Experience the Night Watch
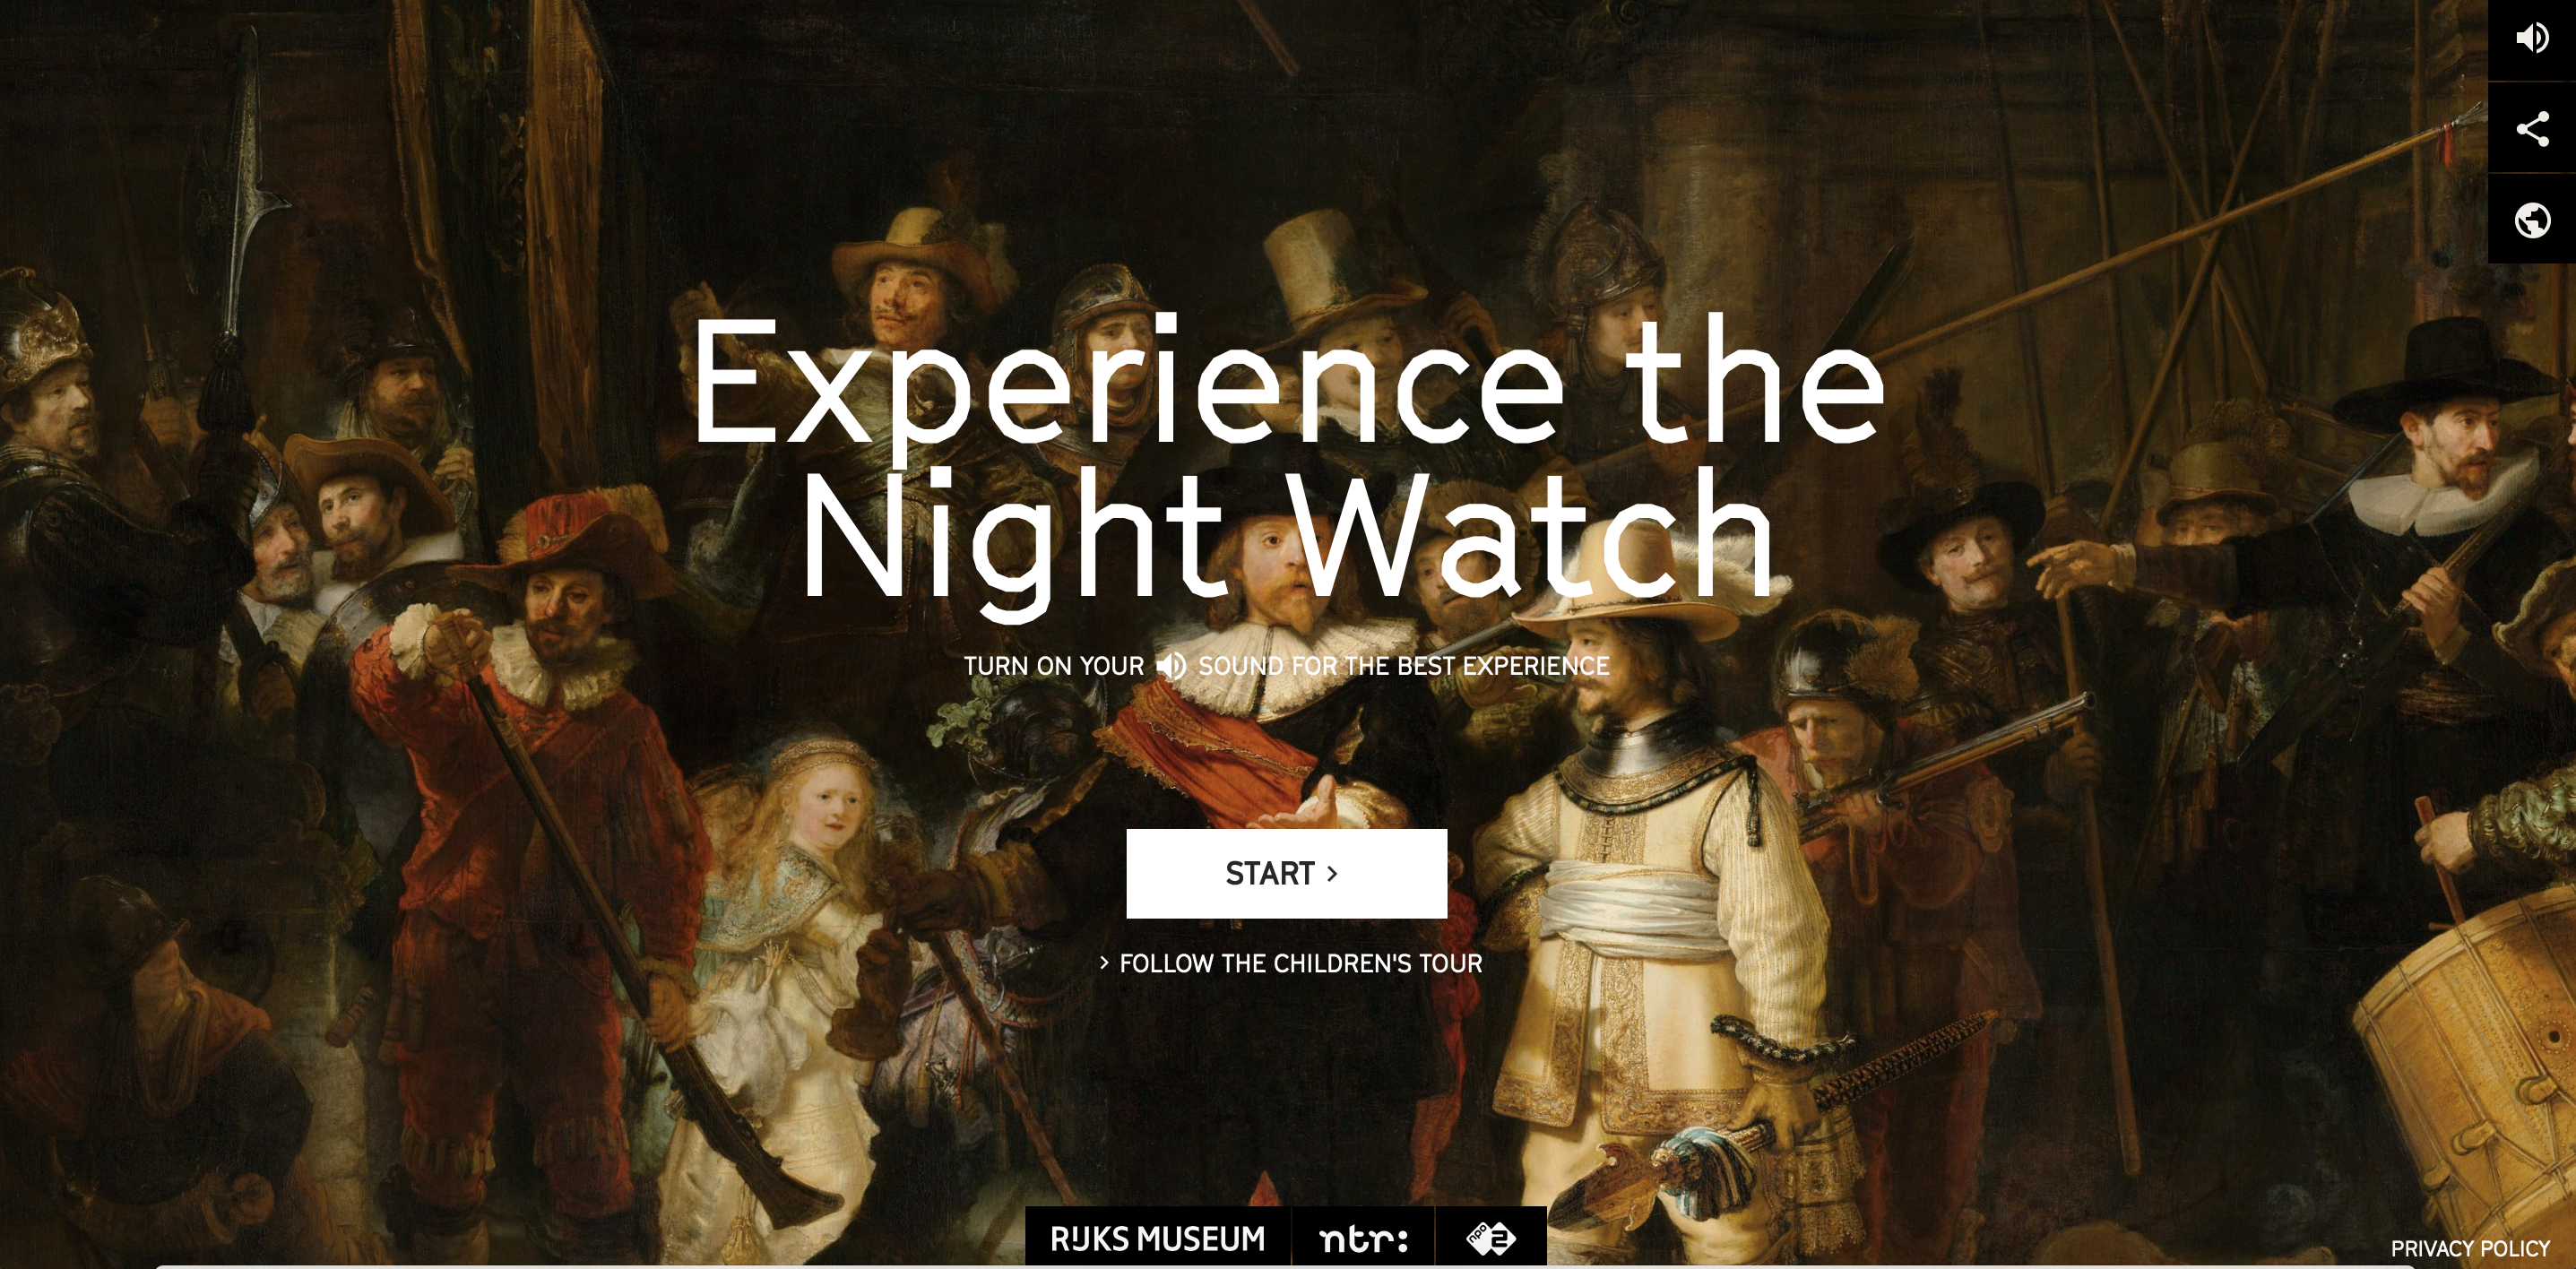
On the occasion of the 350th anniversary of the death of Rembrandt van Rijn, one of the most famous Dutch painters, NTR TV channel and the Amsterdam Rijksmuseum, developed this interactive Night Watch tour. Never have you been able to explore this world-famous painting at such close quarters.
DIY: Try Thinglink to create an interactive photo or video.
La silla Vacia – La indagatoria de Uribe, de pe a pa (Spanish)
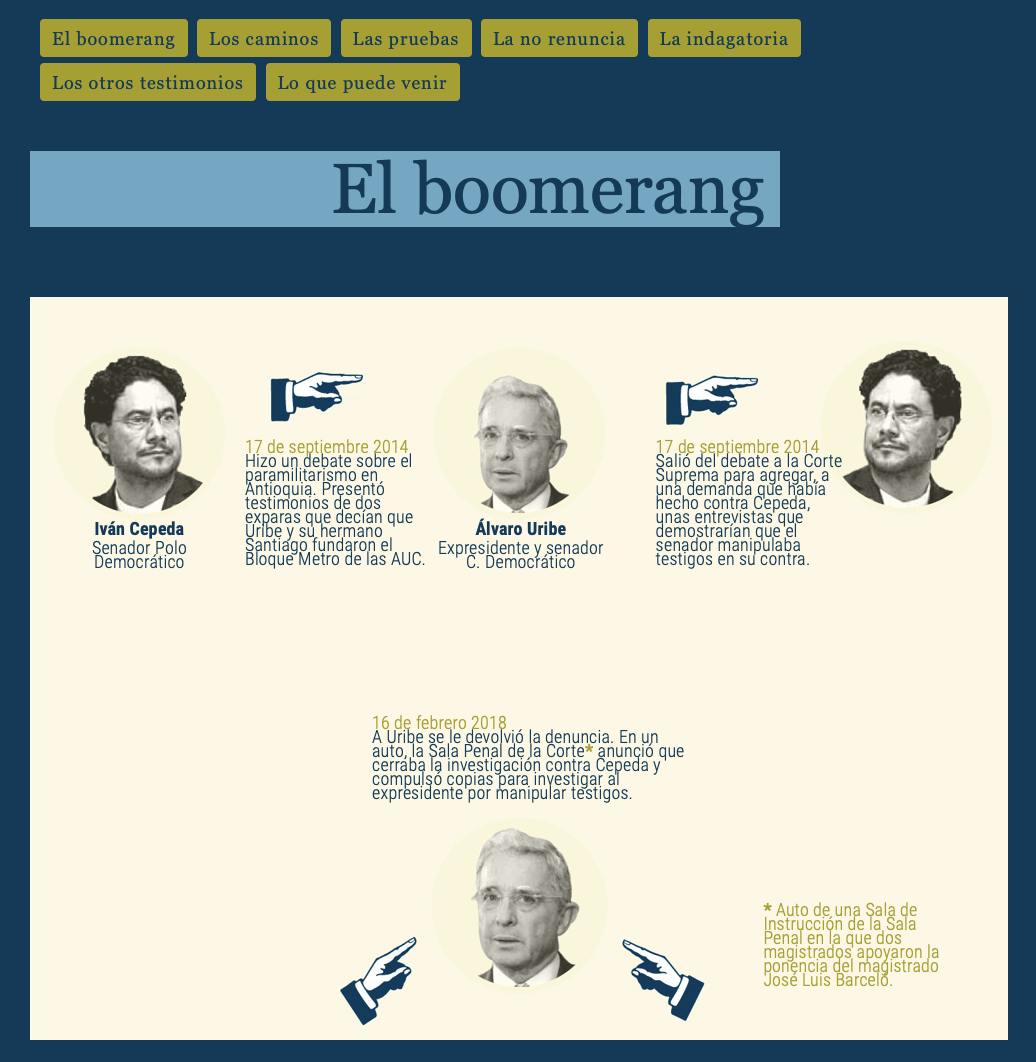
How can you structure complicated follow-ups? La Silla Vacia made a scrolly with different chapters to structure the complex file of Alvaro Uribe’s court case. Meet all the characters and events to understand all facts.
DIY: Make infographics like this with Canva or Venngage. Later you can embed these in a tool to make scrollies.
Straits Times – Inside the Istana: An immersive guide to the President’s official residence

Ever wanted to visit the open house of a president? Take a trip to the Istana, where the president of Singapore lives, through immersive storytelling. Enter the rooms and explore them in 360 view or fly over the building and learn about the architecture. The Strait Times tells you all about this ‘iconic landmark’.
DIY: Make your own story in 360 degrees with SceneVR from Knightlab, our favorite tool builders.
Straits Times – A city divided

This production is divided in two stories: the mother’s anguish and The march of Hong Kong. In the first story you hear, see and read the story of a mother waiting for her sons to come home while worrying about their while being. She barely spoke to them since the mass protests in Hong Kong started in June. The second story is a timeline of the protests.
DIY: Did you know you can easily build a timeline with Timeline.JS and Tiki-Toki.
The New York Times – The shifting city: Shadows of New York

This story, about the shadows of New York, is an example of a new way of digital storytelling inspired by the Instagram Stories. Click through the stories wit a lot of images and little text.
DIY: Pretty straight forward this one: use Instagram. If you don’t want to put it directly on your socials try Steller or Slices.
ARTE – #FrenchArms: les armes du crime (French)
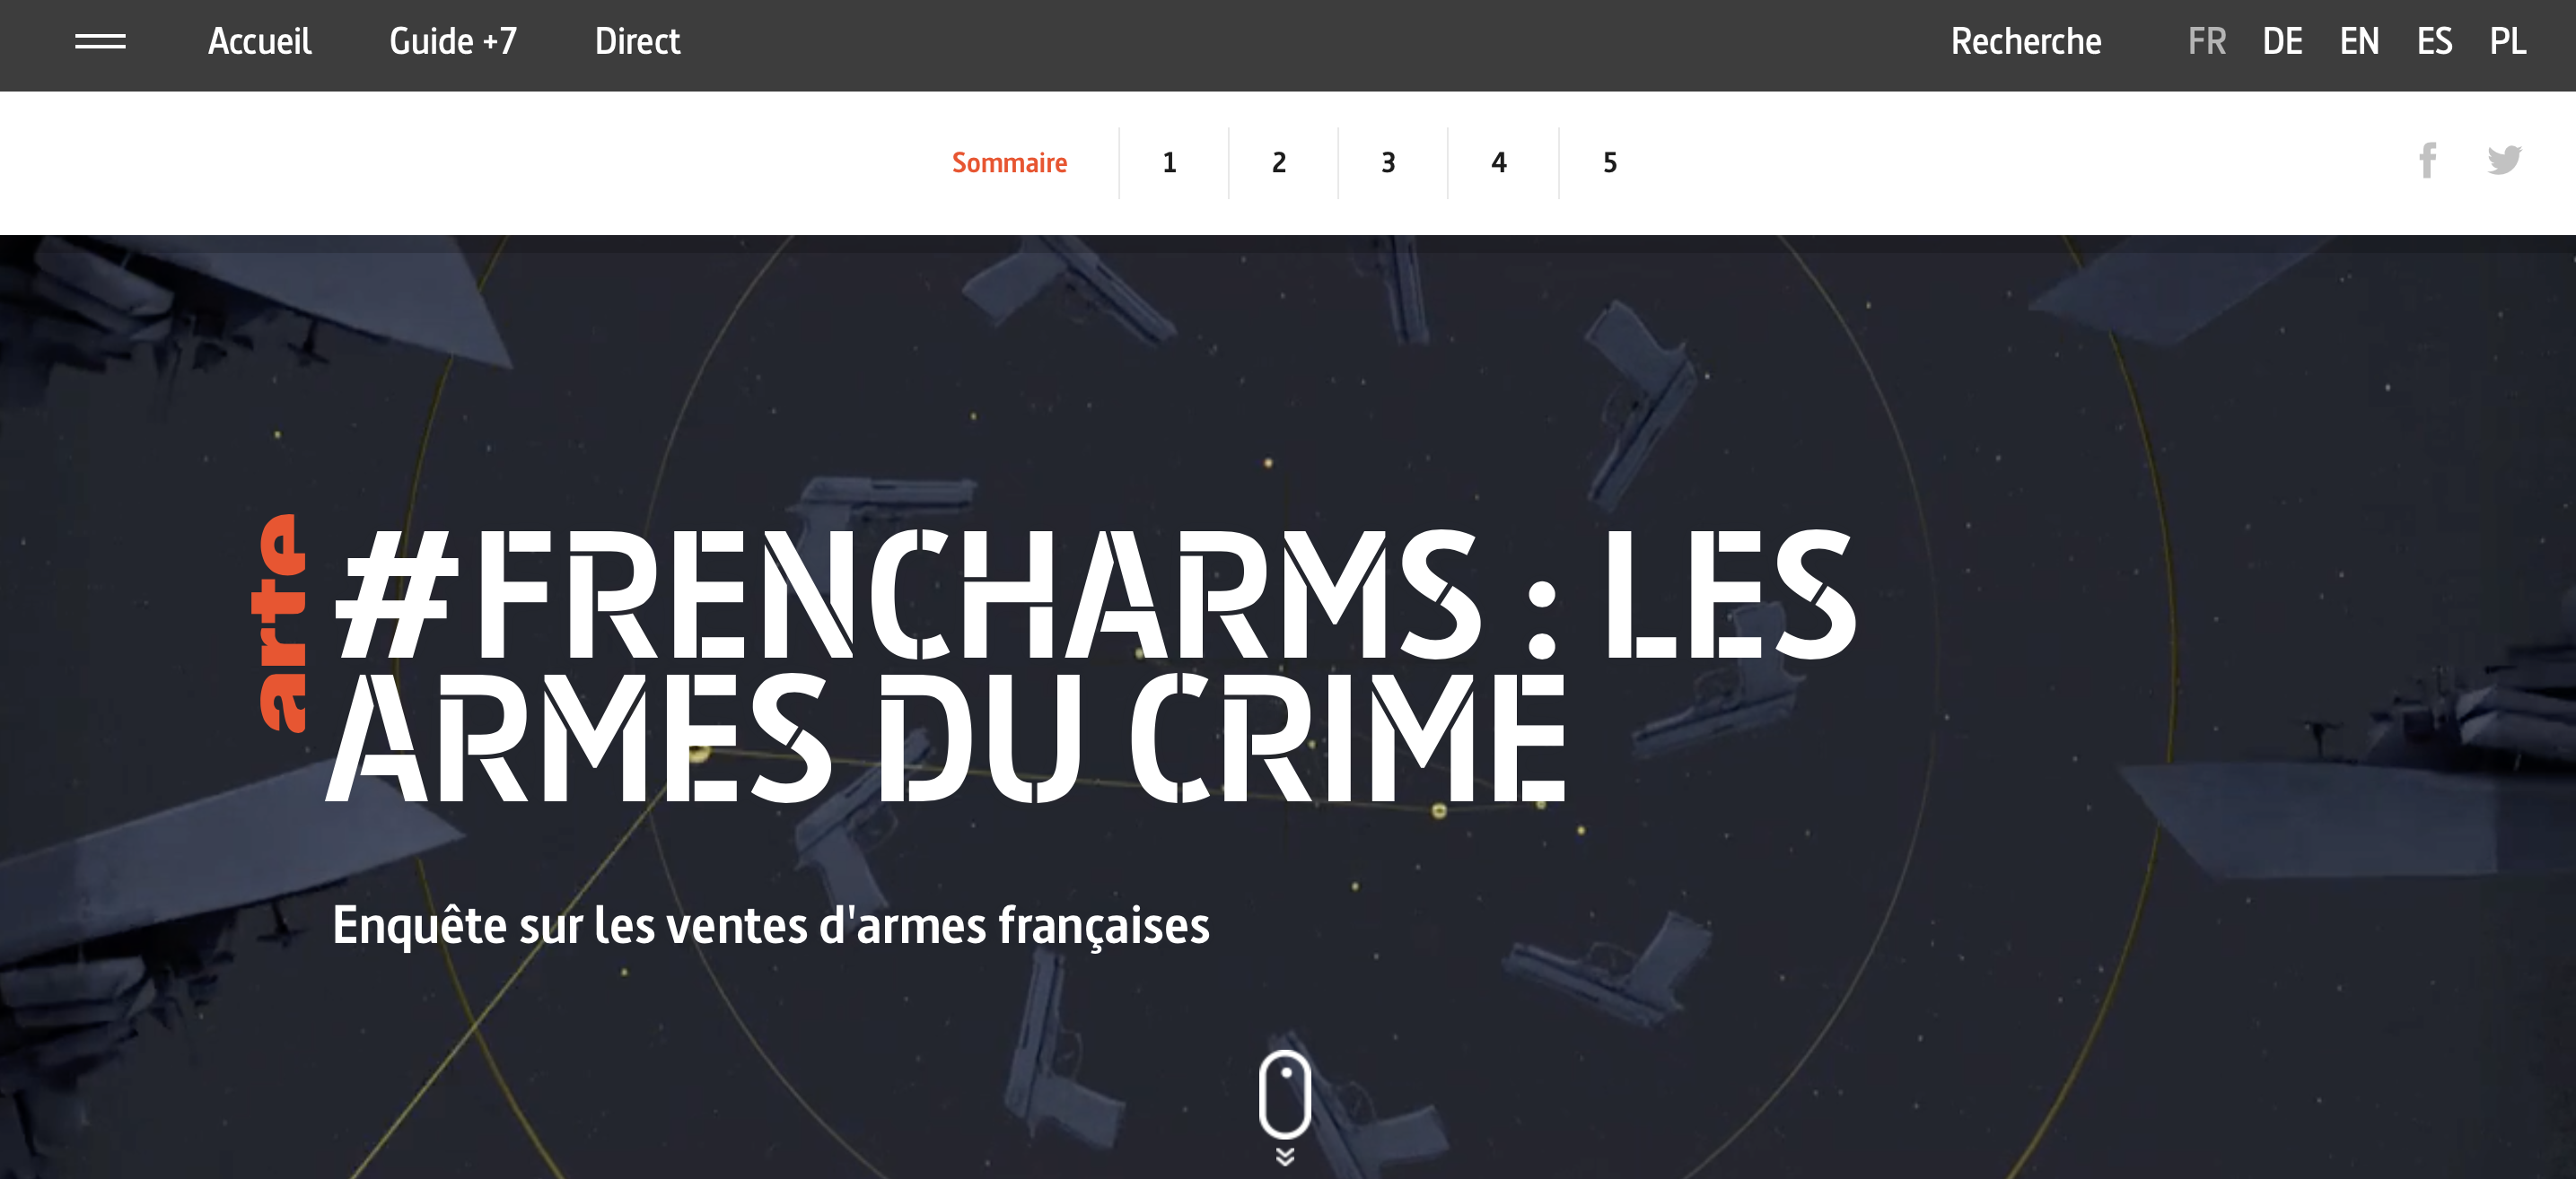
France is the third largest distributor of weapons in the world. Weighing the full impact of this trade is complicated by the lack of available information on where these arms end up. This story is a cooperative work of ARTE, Lighthouse Reports, Disclose, Bellingcat, Mediapart en Radio France. They proof of guns from France are used in war zones in Yemen, Libia, The West Sahara and Cameroon. All stories and evidence can be found on EUarms.com.
DIY: Try the Aesop Story Engine to make a multimedia story divided in chapters. Easily done with this WordPress Plugin.
Die Zeit – Ugandas vergessene Kindersoldaten (German)
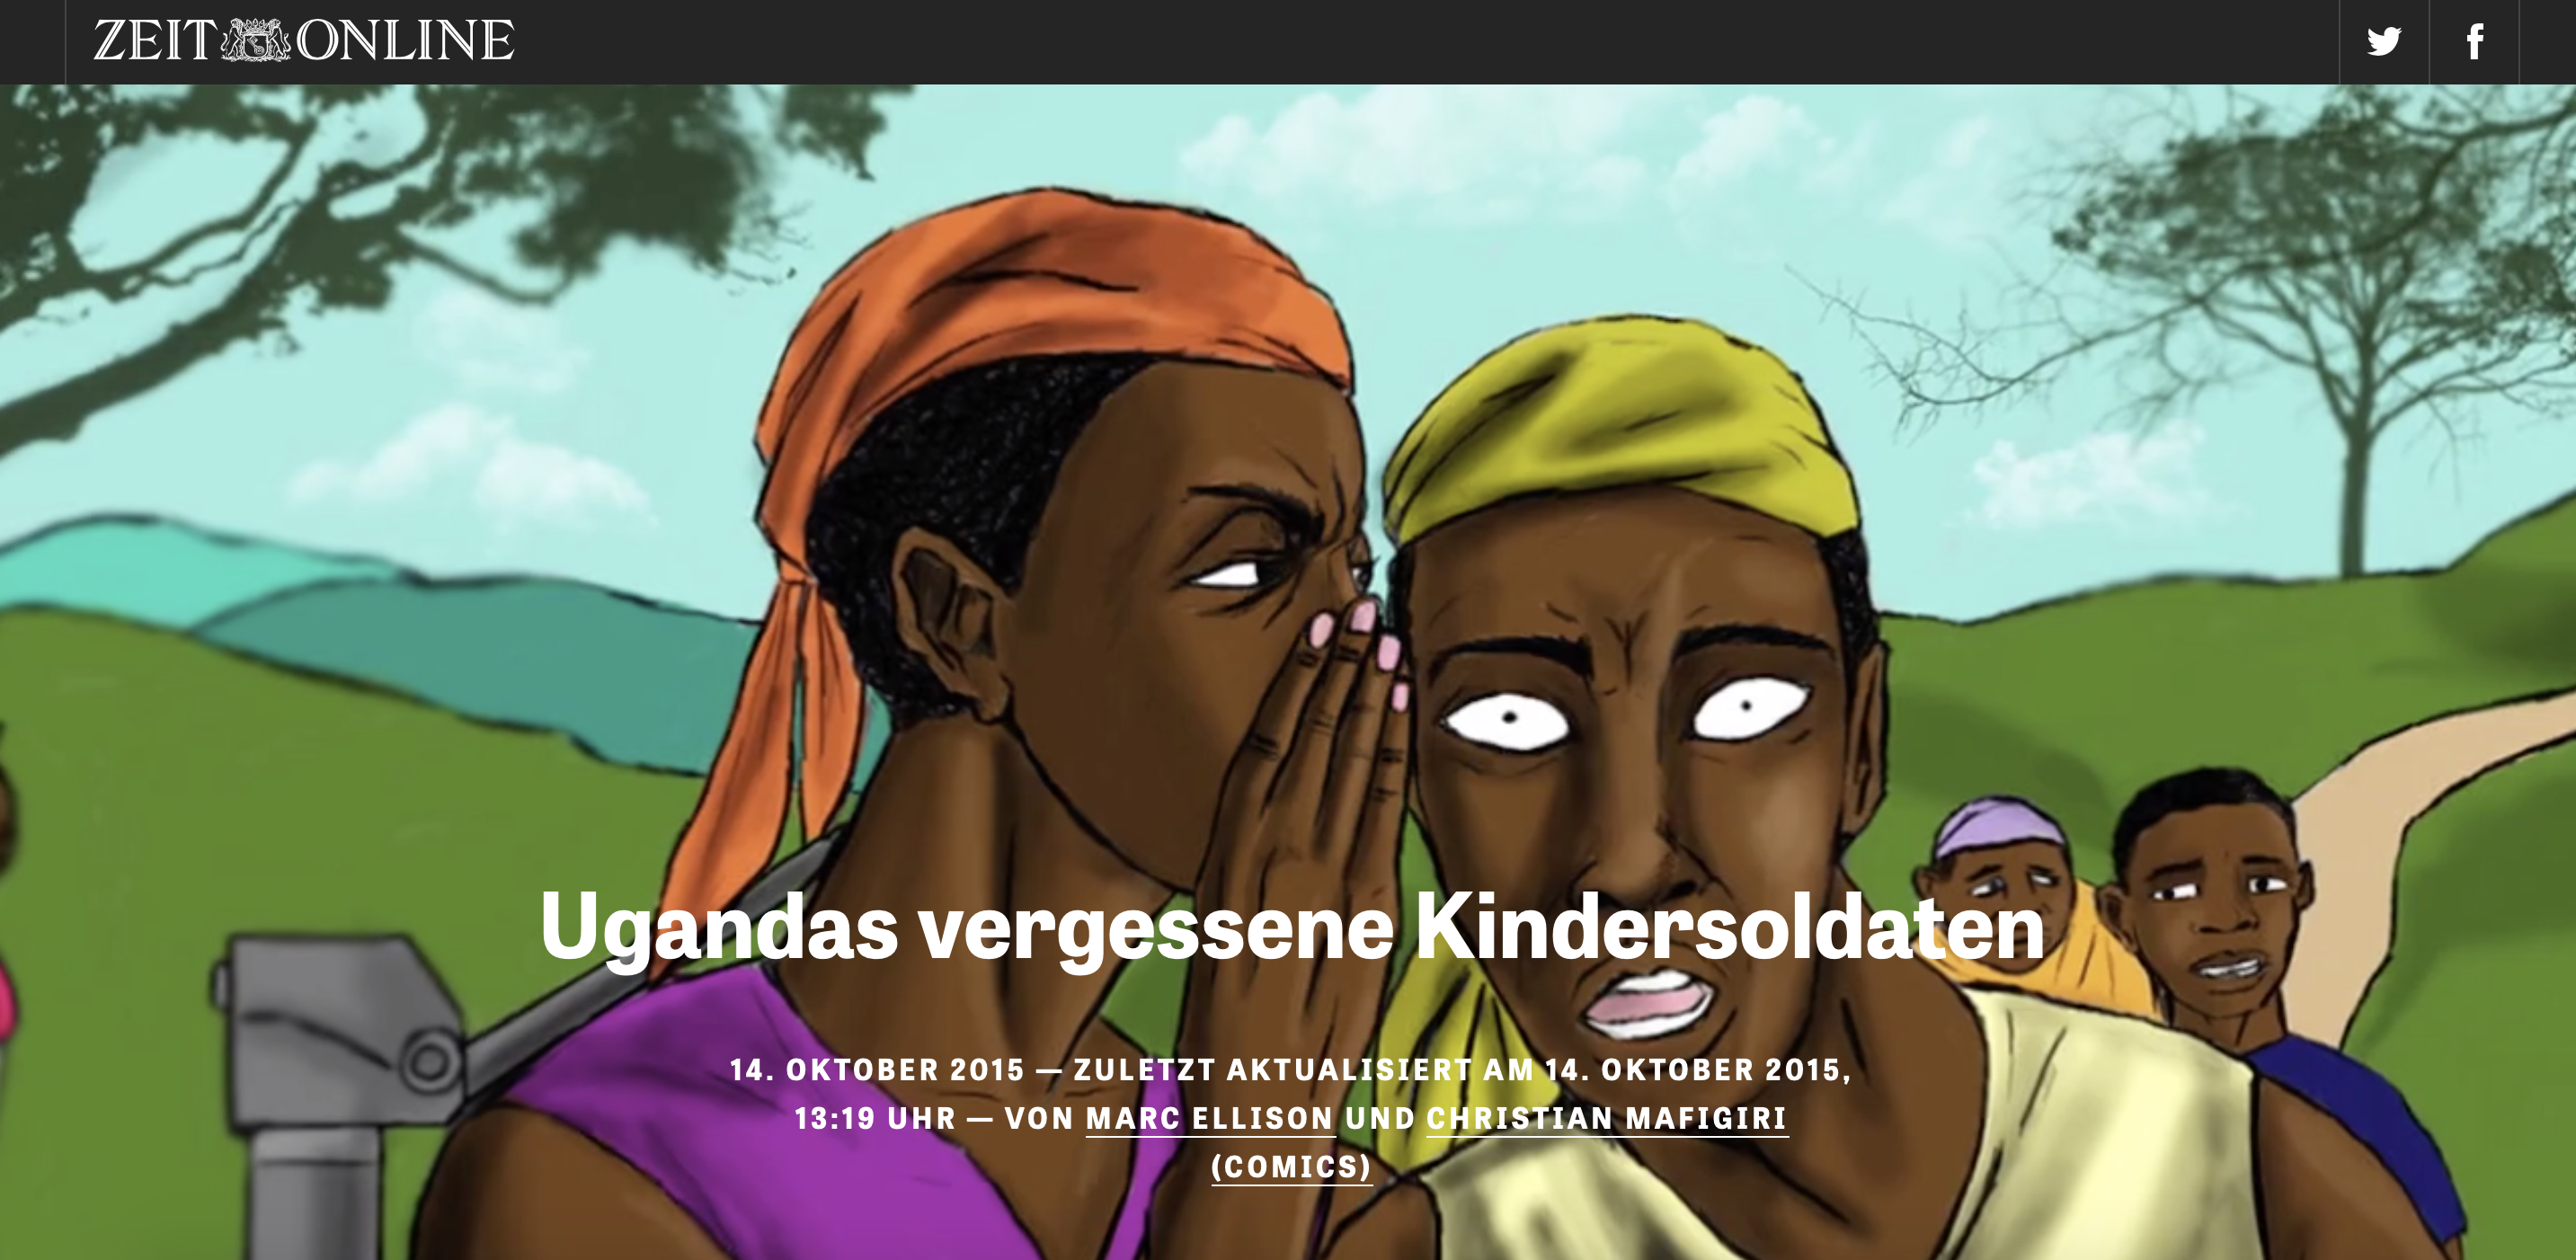
Read the story of child soldiers in Uganda. They were abducted while their parents were away. The children tell you what happened with animated cartoons. The format feels like an online comic book, there for it really feels like the children are telling their story to you instead of a writer or journalist writing down their story.
DIY: Make animated photos like in this story with Plotograph or create animated videos with Animaker. To create something similar like #Frencharms, embed the moving images or videos in a scrolly made with Spark for example.
Der Spiegel – Verkehr: So pendelt Deutschland zu Arbeit
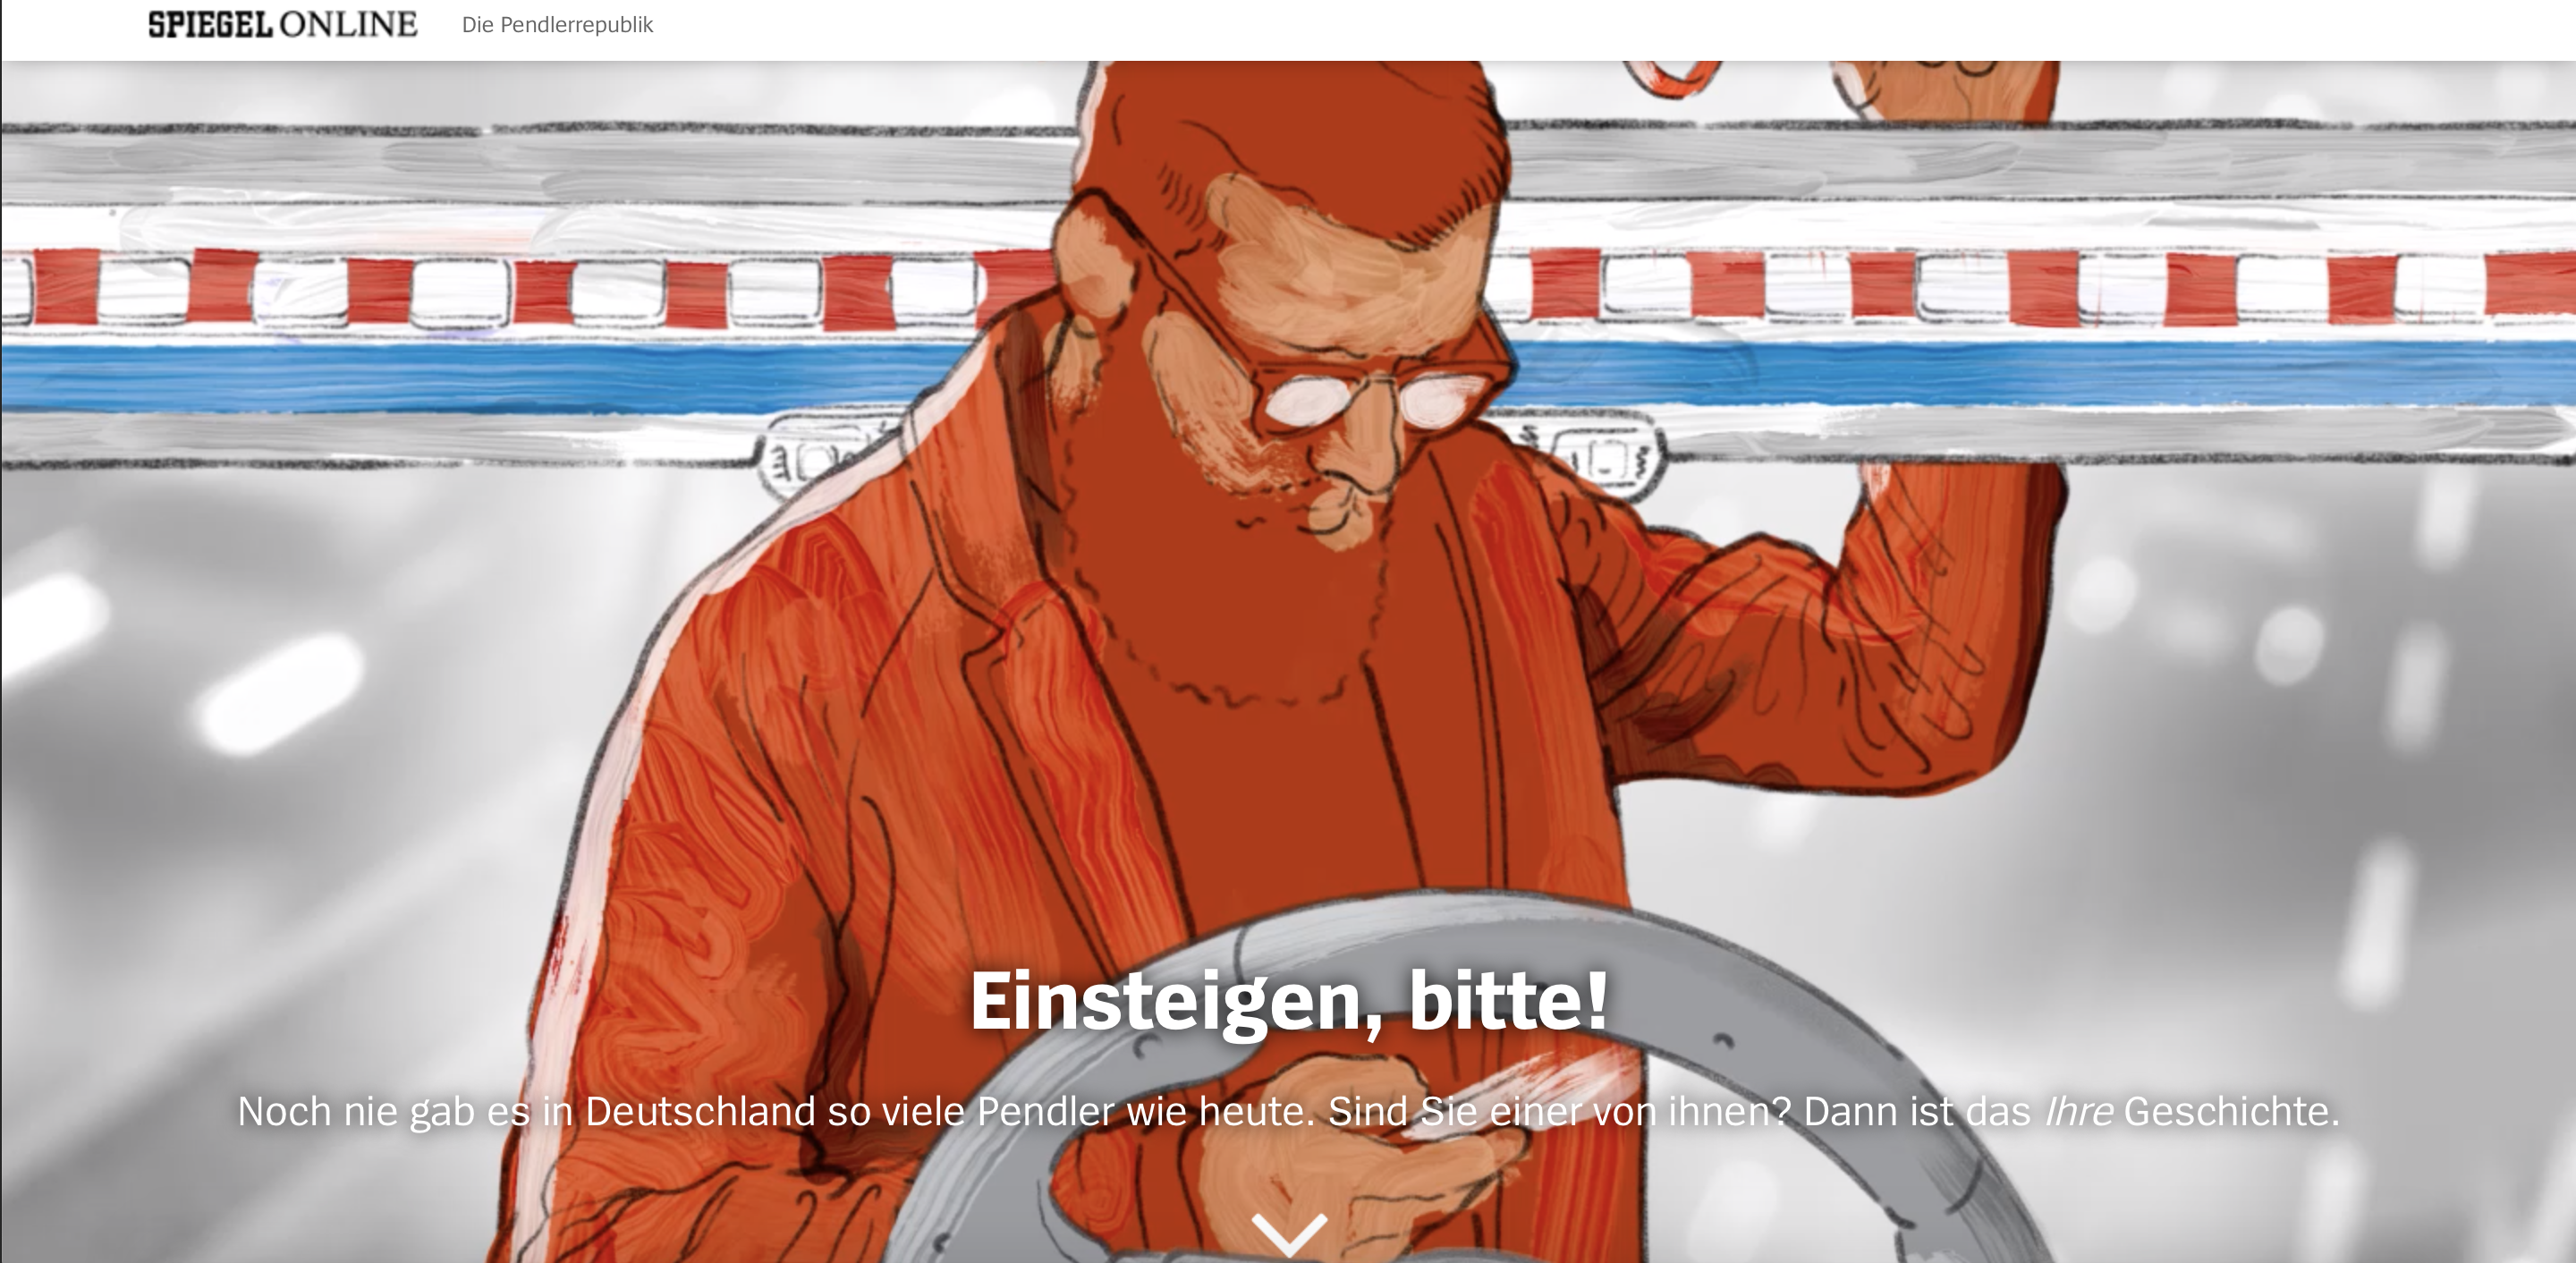
This is a classic interactive in which the ending of the story is dependent on your answers. It shows you how you, and the people you come across commute. After filling in where you live and work, scroll through the infographics to see the data Der Spiegel gathered.
DIY: To make something similar like this is very hard because of the data from your audience. Try to make a more simple version with giving them options with Racontr.
More inspiration:
- The best digital stories of 2019, part I
- The best digital stories of 2018
- The best digital stories of 2017
DIY:
We have an online toolkit: tools.hackastory.com. This is where we list our favorite tools that help you make digital stories. It’s time to start thinkering! Check out these lists with our favorite tools:
